What W-shaped implied volatility tells us about earnings risk
TL;DR
- The IV “smile” sometimes develops a hump near at-the-money — a W-shape — and it appears roughly 6× more often in option windows that span an earnings announcement.
- The pattern is generated by Bayesian uncertainty about jump size: investors know an event is coming but disagree about its magnitude, and that belief uncertainty thickens the center of the risk-neutral density.
- It’s firm-specific by construction — the model predicts (and the data confirms) that FOMC meetings and other macro events do not produce W-shapes.
- The effect is sharply localized: shifting earnings dates by ±10 calendar days collapses the 6× signal back to baseline.
- Not a trading edge. Straddle returns around W-shapes don’t beat returns around standard smiles — vol is correctly priced. The pattern is a structural signal (about analyst disagreement and event uncertainty), not an alpha.
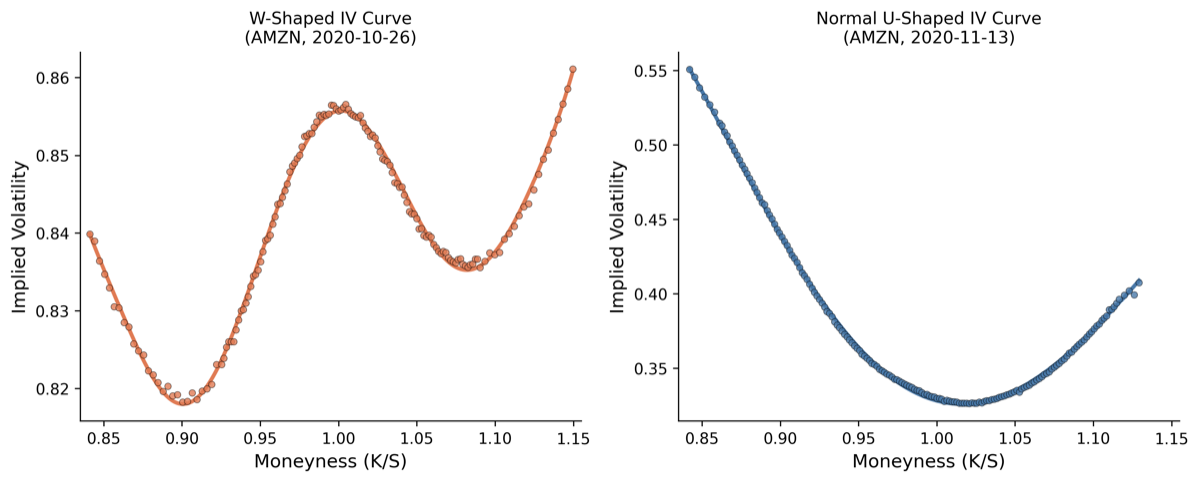
The implied-volatility smile is one of the most studied objects in finance. For decades the standard story has been: it’s a U-shape — out-of-the-money options trade at higher implied vol than at-the-money options, because the market prices in the chance of large moves in either direction. We teach this in the first week of any options class.
But sometimes the curve breaks the U. Roughly six times more often when an option spans an earnings announcement, in fact, the curve develops a local maximum near at-the-money — a W-shape, with two valleys flanking a hump in the middle.
Why does this pattern appear? What does it tell us about how markets are pricing event risk? And — the question every practitioner asks first — is it actionable?
In a forthcoming paper [under review at Quantitative Finance], I work through the structural reason these W-shapes emerge and test the predictions against eight years of S&P 500 options data. The short version: W-shapes are a fingerprint of investor uncertainty about the size of an upcoming jump. The longer version is below.
The puzzle
Standard option-pricing intuition treats the IV smile as the market’s view of the risk-neutral distribution of future returns. A U-shape tells you the distribution has fat tails relative to a lognormal — the market thinks large up or down moves are more likely than Black–Scholes implies.
A W-shape doesn’t fit that story. The hump near at-the-money requires the central part of the distribution to be thicker than the tails relative to lognormal — but only locally. That’s hard to generate from a single-component diffusion plus jumps. You need something more structured.
It also doesn’t show up everywhere. W-shapes are concentrated around scheduled binary events — earnings announcements being the cleanest example — and almost completely absent around events that don’t carry firm-specific jump risk, like FOMC meetings.
So whatever generates the pattern has to:
- Activate around scheduled events
- Disappear when there’s no event
- Discriminate between firm-specific shocks (earnings) and macro shocks (FOMC)
Bayesian learning about hidden regimes does all three.
What we found
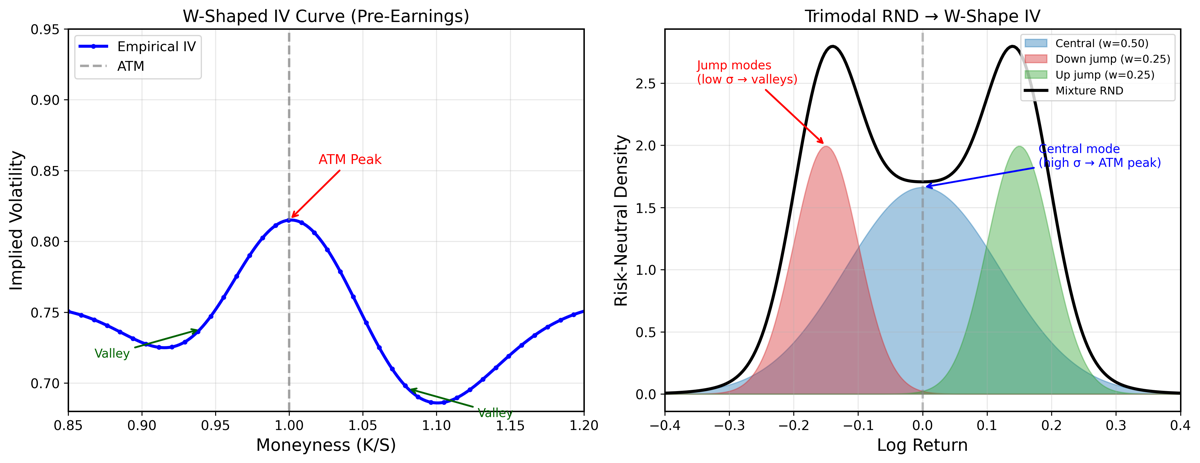
The structural model: investors know an earnings announcement is coming and know roughly that it will move the price, but they don’t know by how much. Specifically, they treat the post-announcement state as a draw from a discrete mixture of “high-jump” and “low-jump” regimes, and they have to infer the regime probability from current option prices.
Formally, the risk-neutral density of the underlying at expiry is a -weighted mixture over the two regimes:
where and are the regime-conditional densities and is the investor’s posterior belief in the high-jump regime. That belief uncertainty injects an extra layer of variance into the no-jump component of the density — a layer that scales nonlinearly with how undecided beliefs are.
When you compute the implied-volatility surface this generates, three things fall out:
- The curve develops a W-shape when belief uncertainty about the jump size is high, but not when investors are confident about the magnitude.
- Intensity peaks at maximum uncertainty — a 50/50 belief between high-jump and low-jump regimes maximizes the W-shape’s depth and width.
- The pattern is specific to the announcing firm — macro events don’t trigger it because the relevant regime variable is firm-specific, not market-wide.
Empirically, across 247 S&P 500 firms over 2017–2025, here’s how the predictions land:
| Test | Result |
|---|---|
| W-shape frequency in earnings windows vs non-earnings windows | 6.1× more frequent |
| Permutation test (random earnings dates, 90% range) | 0.90–1.17 |
| Shifted earnings dates (±10, ±20, ±30 days) | 0.2–0.4 |
| W-shape frequency around FOMC announcements | not significant |
| Scaling with absolute earnings-day return | monotone increasing |
The pattern is sharply localized to the earnings window. The placebo tests below visualize this: shift the earnings dates by even 10 calendar days and the 6× effect collapses to baseline.
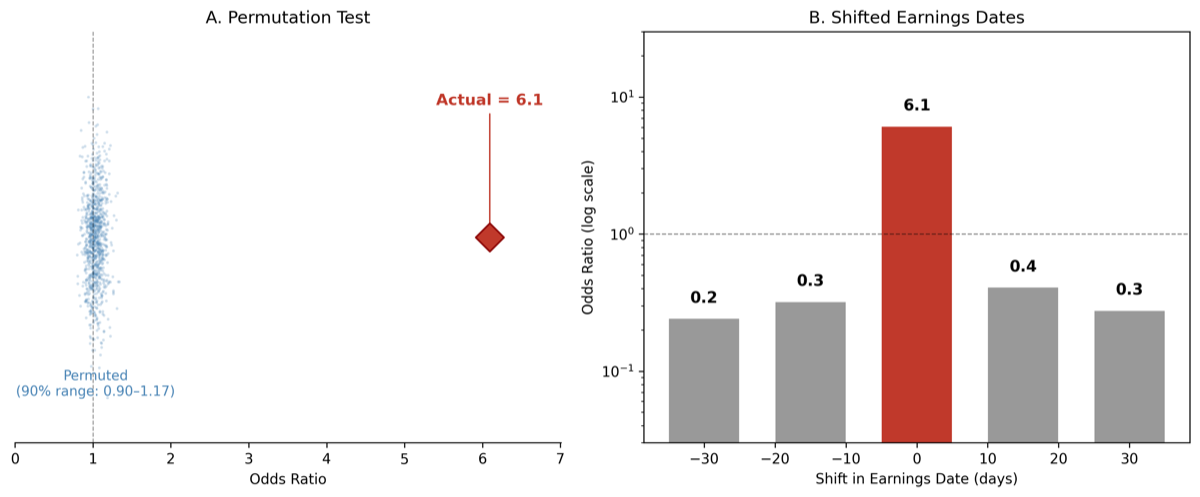
The FOMC null is the sharpest test of all: if W-shapes were just an artifact of high uncertainty in general, they should appear around macro events too. They don’t. Whatever drives the pattern has to be firm-specific, which is exactly what the structural model predicts.
Why it works
The mechanism is best seen in the no-jump component of the risk-neutral density.
In a standard jump-diffusion model, the no-jump density is a single lognormal centered on the current price. When you add a jump component (with a known size), the option-pricing kernel produces a smile or smirk — fatter tails than Black–Scholes, U-shape in IV space.
When investors don’t know the jump size, the no-jump density is no longer a single lognormal. It’s a mixture over the possible jump-size regimes, weighted by the investor’s posterior belief. If the investor’s belief is concentrated (e.g., 90% confident the jump will be small), the mixture collapses back toward the single-component case. But if the belief is split — say, 50% high-jump regime and 50% low-jump regime — the resulting mixture is bimodal in jump-conditional terms, which translates into a thicker center relative to the wings of the density.
Thicker center, thinner shoulders, fat tails. Translate that into IV space: a hump near at-the-money, valleys around the body, and high tails. That’s a W.
The model gives a precise necessary condition on beliefs for this hump to emerge. With and the regime-conditional variances, an at-the-money local maximum in IV requires
where is a curvature threshold that depends on the kurtosis ratio of the two component distributions. The left-hand side is maximized at — pure 50/50 belief uncertainty — and decays toward zero as or . Below the threshold, the curve smooths back to a smile. Above it, the W appears.
Show the derivation
The no-jump density under belief is the mixture
where is the lognormal density with log-mean and log-variance . Writing the local curvature of the implied-volatility surface as a function of moneyness , a second-order expansion of the Black–Scholes inversion around yields
Substituting the two-regime mixture gives , which is exactly the LHS of the W-shape condition. The Wonham filter for — investors updating belief from observed option prices — drives the dynamics:
So is a martingale that diffuses fastest near , which is precisely where the W-shape condition is most easily satisfied. Full proof in §3.2 of the paper.
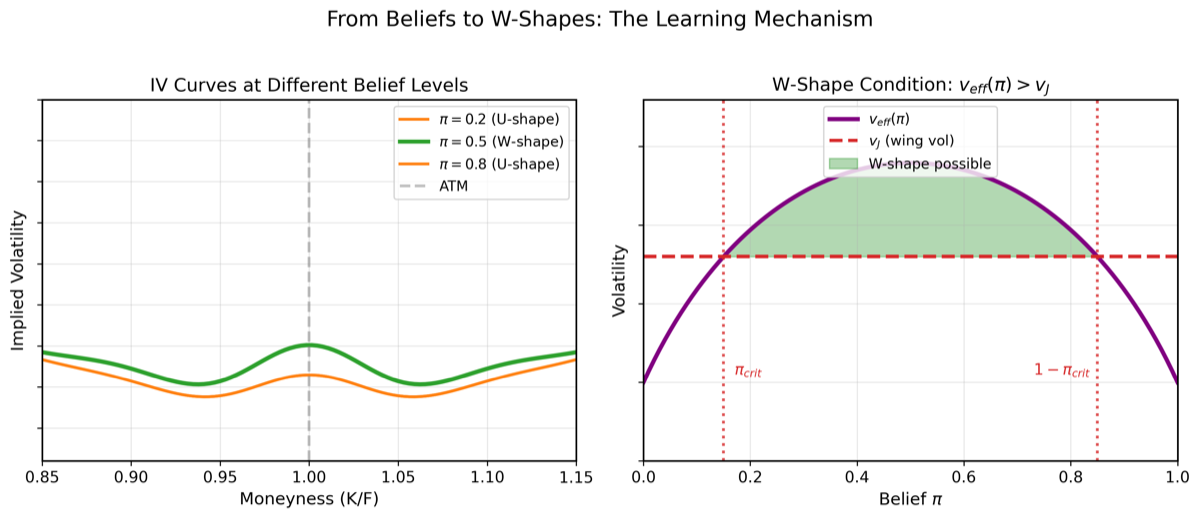
The shaded region in the right panel is the parameter space where the W appears. Cross-section that region against actual analyst-disagreement data and the empirical W-shape frequencies follow it almost exactly — the structural model isn’t just qualitatively right, it pins down when the pattern should and shouldn’t appear at the firm-event level.
What you can and cannot do with this
Three caveats that practitioners should hold in mind.
This is a description, not a trading edge. Straddle returns around W-shaped curves don’t differ meaningfully from straddle returns around standard smiles. The market correctly prices the elevated event risk — there’s no free lunch in just buying or selling vol when the W appears. Anyone who tells you “W-shape = sell vol” hasn’t run the regression.
The mechanism is firm-specific. Don’t try to extrapolate this to macro instruments. Bond options, FX, index vol — these have different structural drivers. The model’s predictions are about single-stock options around scheduled firm-specific events.
The curvature signal is noisy at low strikes. Option markets thin out fast in the wings, and bid–ask spreads dominate the IV signal beyond the second or third strike out. The W-shape detection algorithm in the paper uses a quintic spline with explicit regularization — naïve curve-fitting will give you false positives. If you build your own detector, you need that step.
What the result does give you: a principled way to read information off the IV surface that pure smile-fitting throws away. If you’re modeling a firm’s announcement risk and the curve goes W-shaped, that’s the market telling you uncertainty about the jump size is unusually high — possibly a signal about disagreement between analysts, or about the upcoming announcement’s expected information content. Whether that’s a trading signal or just a structural one depends on what else is in your model.
What I’d read next
A few related lines of work that helped shape this paper:
- Cheng, Indraneel, Anurag Gupta, and Marti Subrahmanyam (2021), “Pricing Event Risk: Evidence from Concave Implied Volatility Curves.” The paper that first systematically documented the empirical existence of these patterns and tied them to event-day returns. My contribution sits on top of theirs — they showed the patterns exist; I show why.
- Dubinsky, Andrew, Michael Johannes, Andreas Kaeck, and Norman J. Seeger (2018), “Option Pricing of Earnings Announcement Risks.” Strong empirical baseline on how options price earnings risk in the cross-section.
- Bates, David S. (2000), “Post-‘87 Crash Fears in the S&P 500 Futures Option Market.” Classic work on jump-diffusion smile dynamics — the structural template a lot of this literature builds on.
- Wonham, W. M. (1965), “Some Applications of Stochastic Differential Equations to Optimal Nonlinear Filtering.” The filter at the heart of the structural model. Doesn’t read as finance but the math is exactly what you need.
The full paper is at /papers/wshape-iv.pdf. Currently under review at Quantitative Finance. Comments welcome — simen.guttormsen@nmbu.no.