Crisis-origin dependence in sector volatility spillovers
A standard volatility-spillover study takes a connectedness measure — Diebold-Yilmaz, network-style — and tracks it across time. The narrative writes itself: connectedness rises during crises, falls when things calm down, and you can flag risk regimes off the time series.
That headline is true and almost useless on its own. A 2018 tightening event, a pandemic shock, a regional-banking blow-up, and a tariff-driven trade conflict all show elevated connectedness — but the identity of which sectors transmit risk during each is not the same. This paper tests whether crisis-origin systematically reshapes the spillover architecture, and the short answer is: it does.
The setup
The data are daily 30-day at-the-money implied volatility for nine U.S. sector ETFs from January 2015 through March 2025. The window covers six crises whose origins look nothing alike:
- Oil/China shock (2015–2016)
- Volmageddon tightening (2018)
- COVID-19 pandemic (2020)
- High-inflation monetary tightening (2022–2023)
- SVB banking stress (2023)
- Tariff crisis (2025)
The methodology is the quantile vector autoregression (QVAR) framework of Ando et al. (2022), estimated at nine deciles (). The median () is the main reference, but the full quantile structure is used to test whether crisis-specificity differs across the conditional distribution.
A regime classification splits the sample into 14 regimes — six crises plus calm and transition periods between them — using documented start/end dates and a rolling-window purity diagnostic.
Connectedness rises during crises, but that’s the easy part
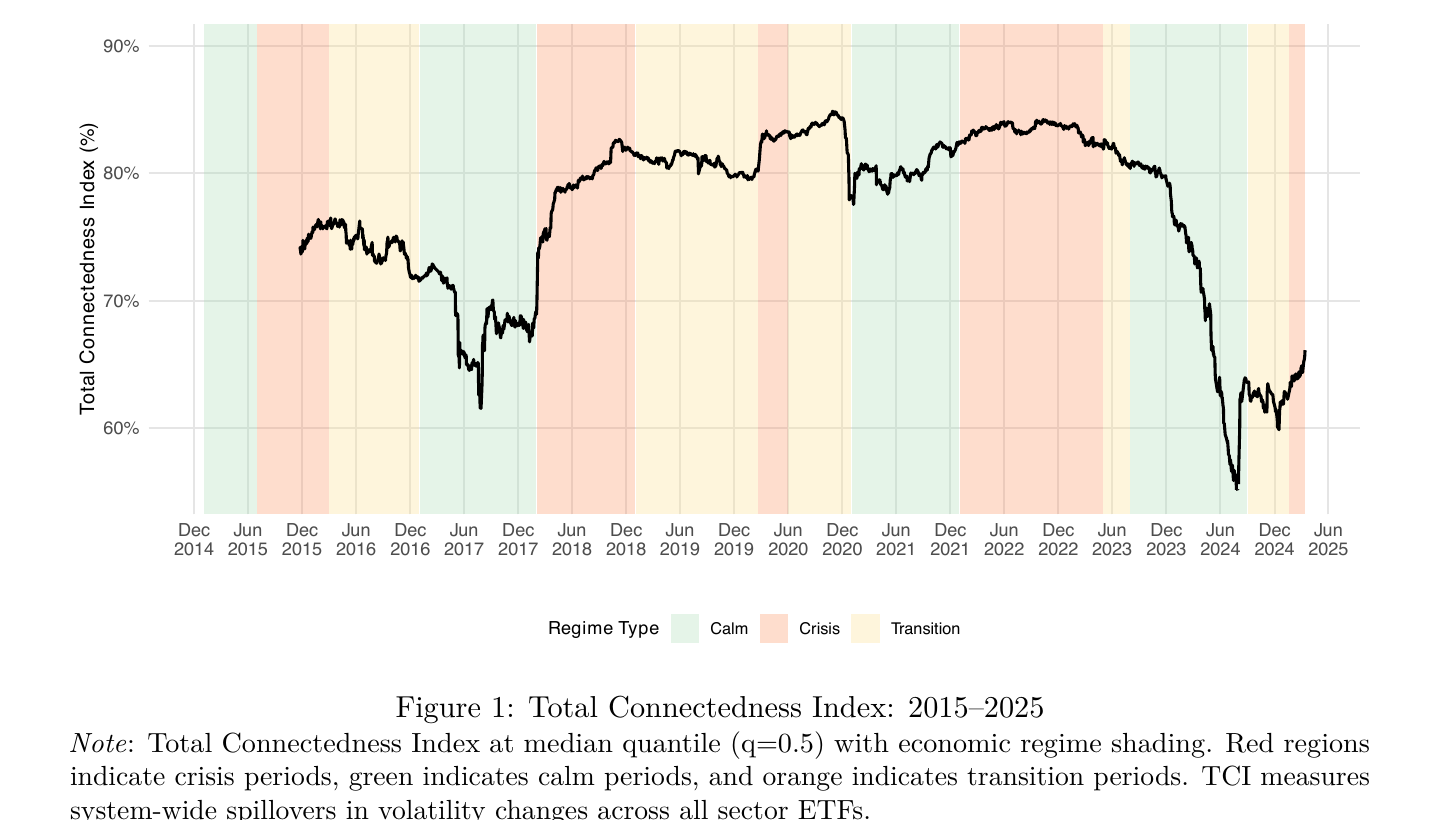
The Total Connectedness Index (TCI) replicates what the broader literature has documented: spillovers among U.S. sector-ETF implied volatility are time-varying and elevated during crisis periods. Useful as a baseline, not the headline of this paper.
The cyclical-defensive divide is the persistent backbone
Before testing crisis-specific transmission patterns, the paper documents a structural regularity that holds across all 14 regimes: cyclical sectors (XLI, XLY, XLK) consistently act as net transmitters of volatility, defensive sectors (XLU, XLP, XLV) consistently act as net receivers.
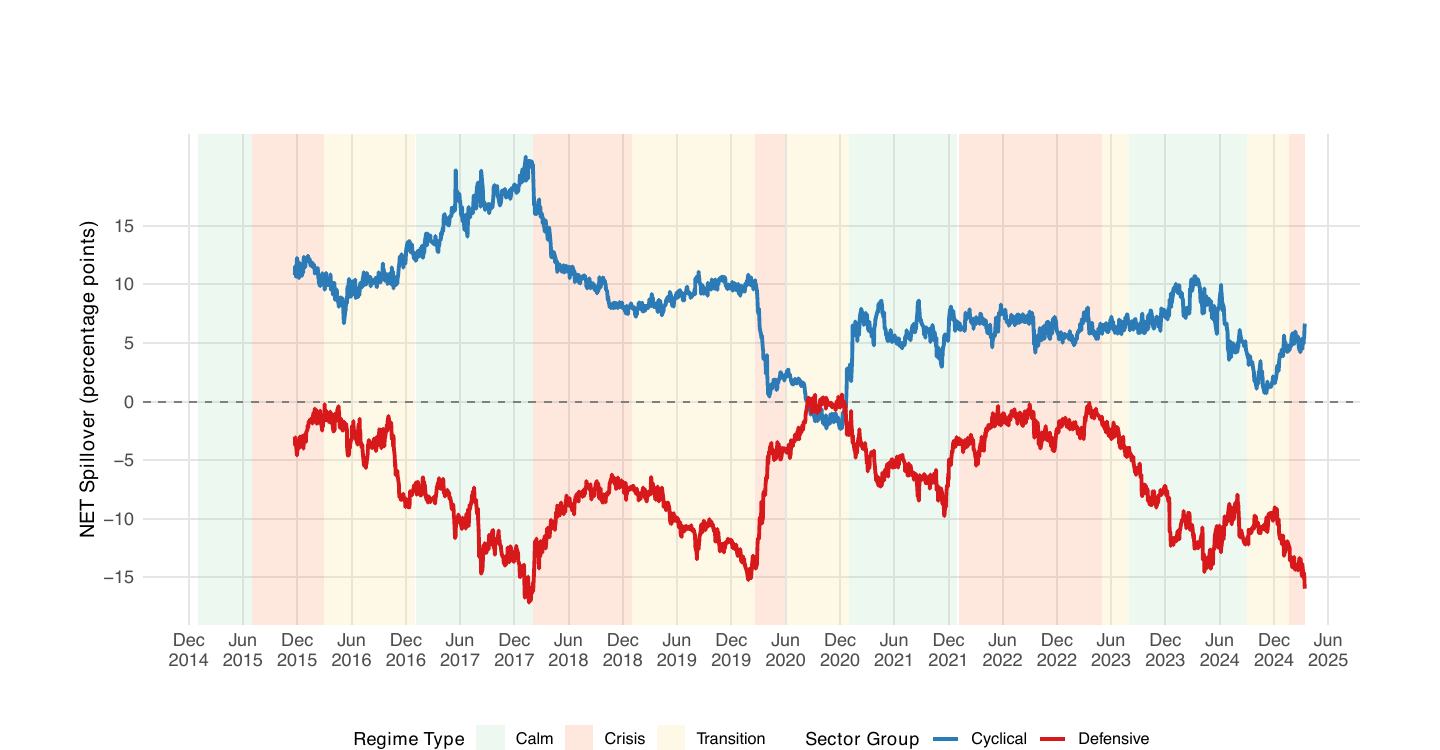
The cyclical-defensive divide is positive in all 14 regimes. From the paper’s reported numbers, the divide ranges from +1.19 percentage points (COVID Recovery) to +27.44 (Low Vol Expansion), with an average of +13.80 pp. Crises narrow the gap by absorbing more sectors into the transmission process; calm periods widen it.
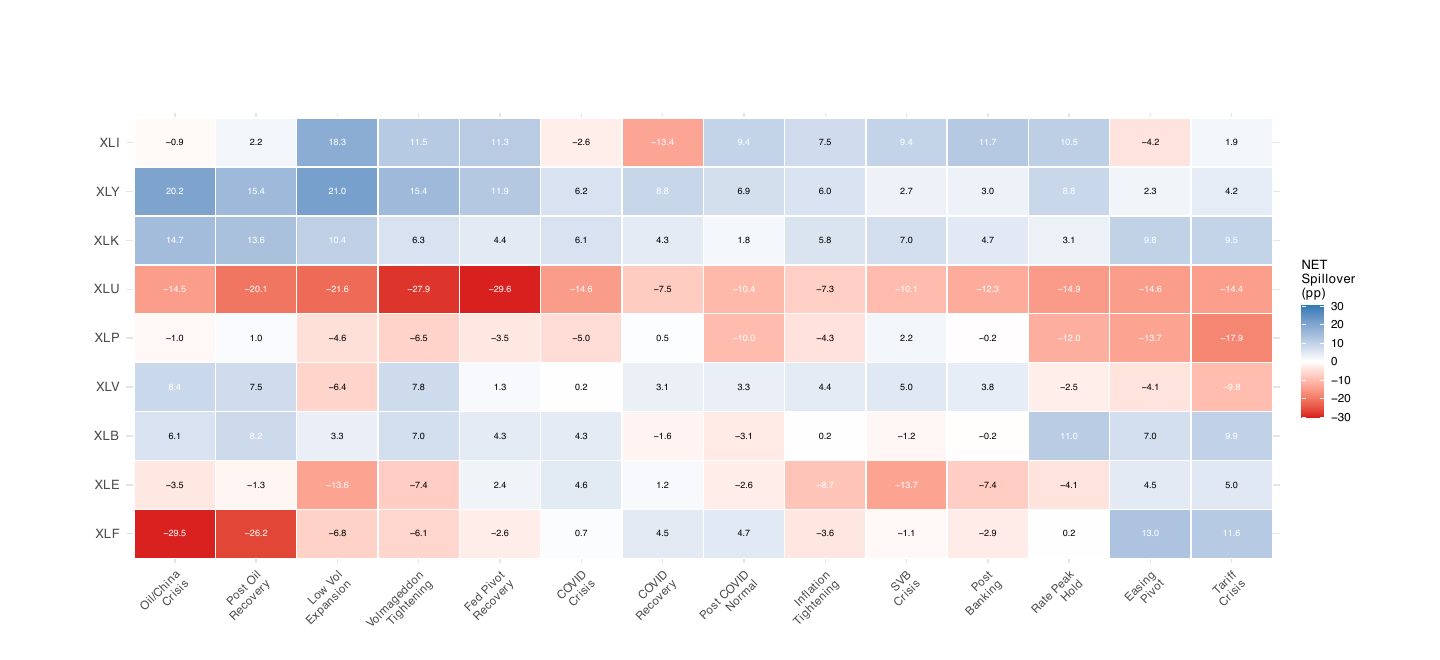
The heatmap below makes the persistence visible at the sector level — XLU is the only sector with negative NET spillovers in every regime; cyclicals (XLI, XLY, XLK) are net transmitters in nearly every regime, with magnitudes that move with the calm/crisis cycle.
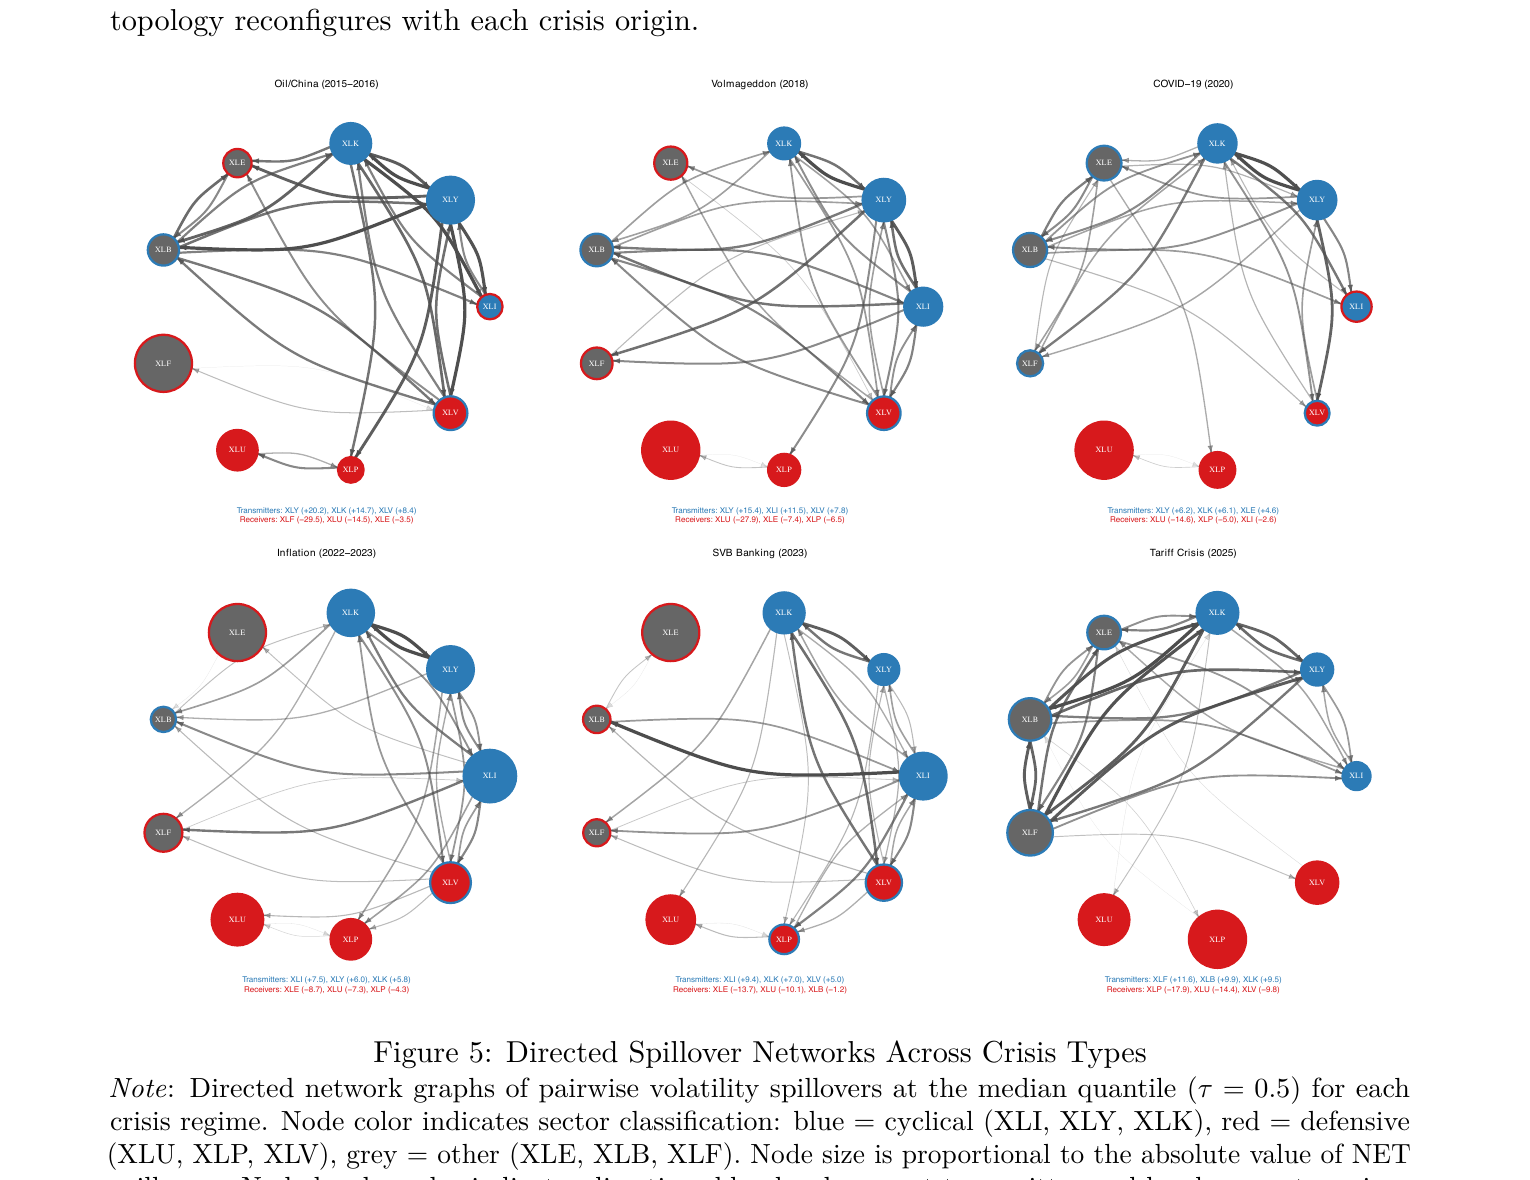
The hierarchy reorders with each crisis
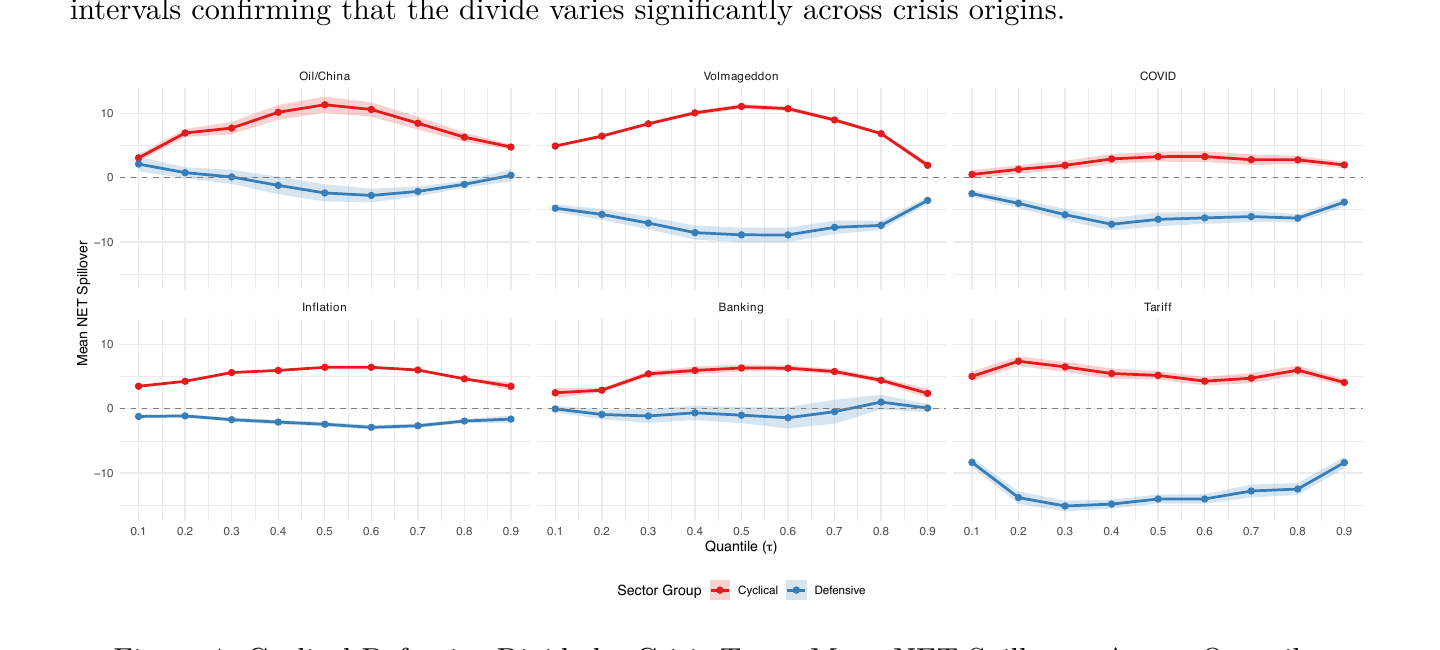
This is the central finding. Wald tests of equality of cross-crisis transmission patterns are rejected at all nine quantiles, including under Bonferroni correction. The same panel-regression test on the cyclical-defensive divide rejects equality with F-statistics ranging from 66.0 to 303.3 across quantiles (all ); at the median, .
The who-transmits-what question, summarized from the paper’s top-3 transmitter analysis (Table 5):
- Oil/China shock (2015–2016): XLK (Technology) appears in 100% of top-3 quantile-windows; XLY (Consumer Discretionary) at 78%; XLV (Healthcare) at 67%. Tech and consumer-discretionary leadership.
- Volmageddon (2018): XLY at 100%, XLI (Industrials) at 89%, XLV at 78%. Cyclical leadership.
- COVID-19 (2020): XLE (Energy) appears in 89% of top-3 spots — the distinctive pandemic-era transmitter, absent from the top-3 in any other crisis. Materials (XLB) also reaches 22%.
- High-Inflation Tightening (2022–2023): XLI at 100%, XLY at 33%. Industrials-led tightening response.
- SVB Banking Crisis (2023): XLV at 100%, XLK at 100%. Notably, XLF (Financials) is not in the top-3 — the banking crisis is transmitted into financials by other sectors, not led by them.
- Tariff Crisis (2025): XLF at 67%, XLY at 67%, XLI at 0%. The unprecedented appearance of Financials as a leading transmitter — XLF was at 0% in every prior crisis, then jumps to a +11.59 NET spillover during Tariff.
No sector appears in the top-3 across all six crises. The Spearman rank correlation across crisis-pair leadership rankings averages , ranging from 0.03 (Tariff vs. SVB Banking) to 0.90 (Inflation vs. SVB Banking).
The directed-network panels make the rotation visible — same nine nodes, same layout, six different topologies:
Utilities: the only pure safe haven
The paper goes further than just identifying defensive-sector receivers in aggregate. Among the three defensive sectors, only Utilities (XLU) is a net receiver in every one of the 14 regimes — even during low-volatility expansion regimes where one might expect the safe-haven flow to reverse.
Consumer Staples (XLP) is negative in 11 of 14 regimes; Healthcare (XLV) only in 4 of 14. The conventional “defensive” label, in other words, does not guarantee safe-haven behavior — the empirically pure safe haven in this dataset is XLU alone.
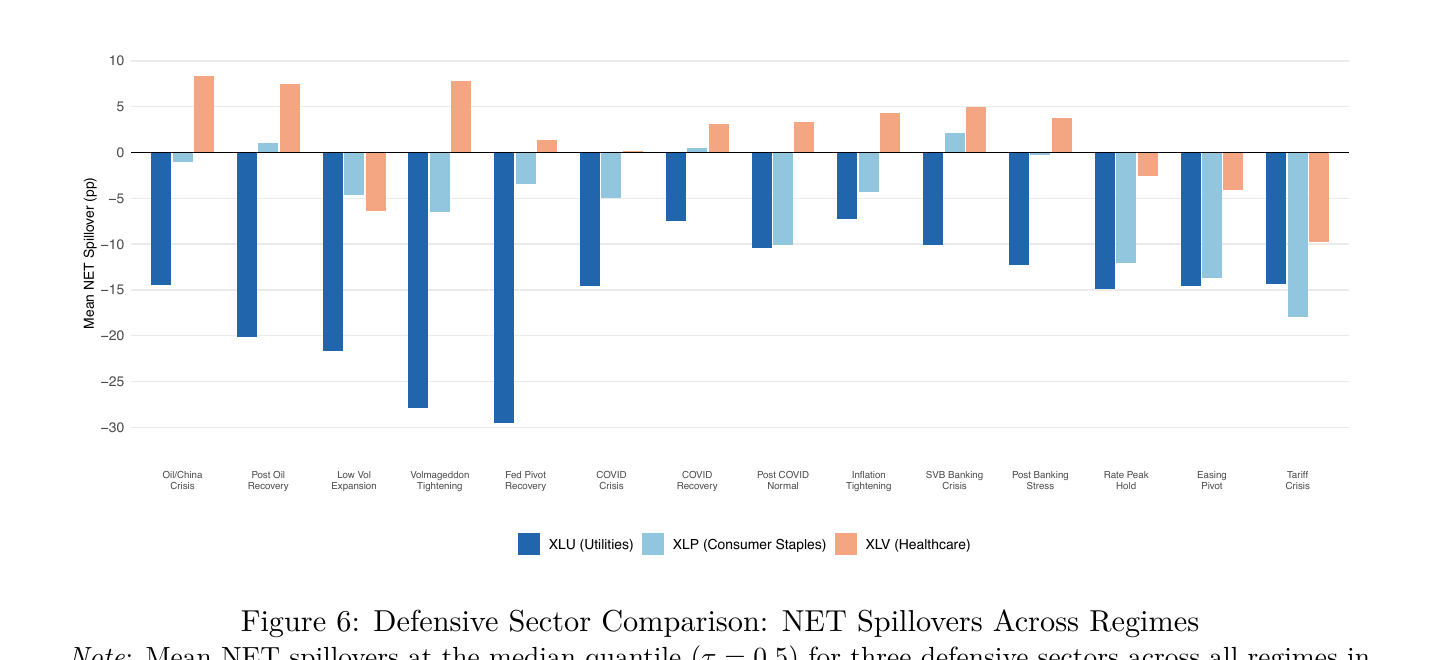
A plausible structural read: XLU’s safe-haven status reflects its regulated-monopoly profile — stable cash flows, high dividend yields (typically 3–5%), and bond-like income characteristics that attract defensive capital regardless of which crisis-origin is driving the broader system.
What the result says — and doesn’t
The paper’s framing is careful, and worth keeping intact in this writeup:
Crisis-origin matters for the transmission architecture. A model calibrated on one crisis will not necessarily replicate the spillover topology of the next one. Sector rotation in transmitter leadership is real, statistically detectable, and economically meaningful (the COVID emergence of XLE; the Tariff emergence of XLF).
Within crisis-specific reordering, a stable structural backbone holds. The cyclical-defensive divide is positive in every regime; XLU is a receiver in every regime. The architecture changes but it changes within this larger cyclical-defensive structure.
Methodological caveat: regime purity matters. Crisis windows are short, rolling estimation windows are long, and the resulting estimates inevitably blend within- and adjacent-regime observations. The paper introduces an explicit regime-purity diagnostic — Inflation Tightening (65.85%) and Volmageddon (55.6%) have the highest purity; COVID, SVB Banking, and Tariff have shorter durations and lower purity. The crisis-equality tests reject regardless, but readers who want to weight the evidence toward higher-purity regimes can do so.
This is a description of network architecture, not a directional trading edge. Knowing that XLF transmits during Tariff and XLE transmits during COVID tells you something about risk topology during those regimes — not about which positions to take in the names themselves.
What I’d read next
- Diebold, Francis X., and Kamil Yilmaz (2014), “On the Network Topology of Variance Decompositions.” The connectedness framework that everything in this literature builds on.
- Ando, Tomohiro, Matthew Greenwood-Nimmo, and Yongcheol Shin (2022), “Quantile Connectedness.” The specific quantile-VAR connectedness machinery this paper applies.
- Antonakakis, Nikolaos, Ioannis Chatziantoniou, and David Gabauer (2020), “Refined Measures of Dynamic Connectedness based on Time-Varying Parameter Vector Autoregressions.” TVP-VAR alternative to rolling-window connectedness — useful comparison for the regime-purity discussion.
- Laborda and Olmo (2021), “Volatility spillover between economic sectors in financial crisis prediction.” European-equity sector-spillover study showing banking-led transmission in 2008 vs. energy/tech in COVID-19 — direct precedent for the crisis-specificity finding documented here on U.S. data.
The full paper is at /papers/crisis-type-spillover.pdf. Currently under review at International Journal of Finance & Economics. Comments welcome — simen.guttormsen@nmbu.no.